
About The Database
The dataset in question is a publicly available Kaggle compilation of passenger feedback records, comprising 129,000 anonymized survey responses. Although the specific carrier(s) are not identified, survey responses were collected via post‐flight emails sent to passengers immediately after landing, ensuring feedback remained timely. Each survey gathers basic demographics (gender, age, travel class), detailed service ratings (online booking, check‐in, food and beverage, etc.), and an overall satisfaction score.
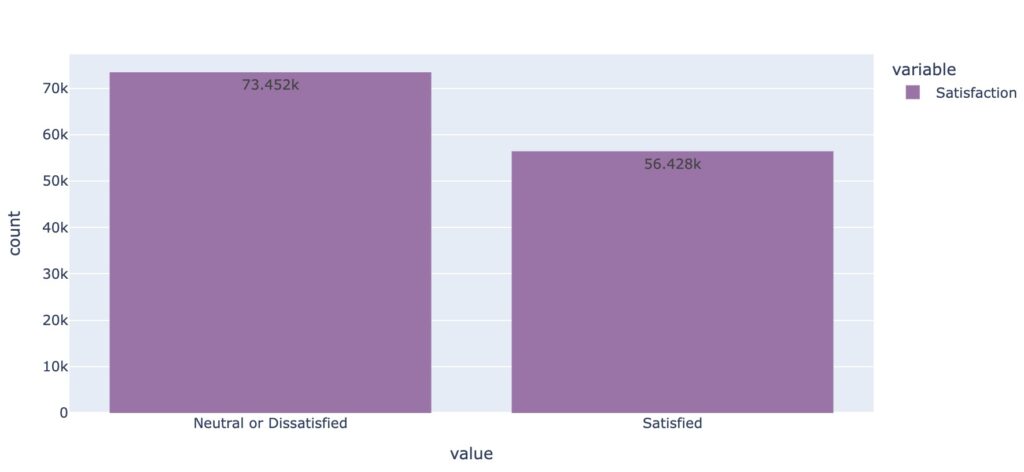
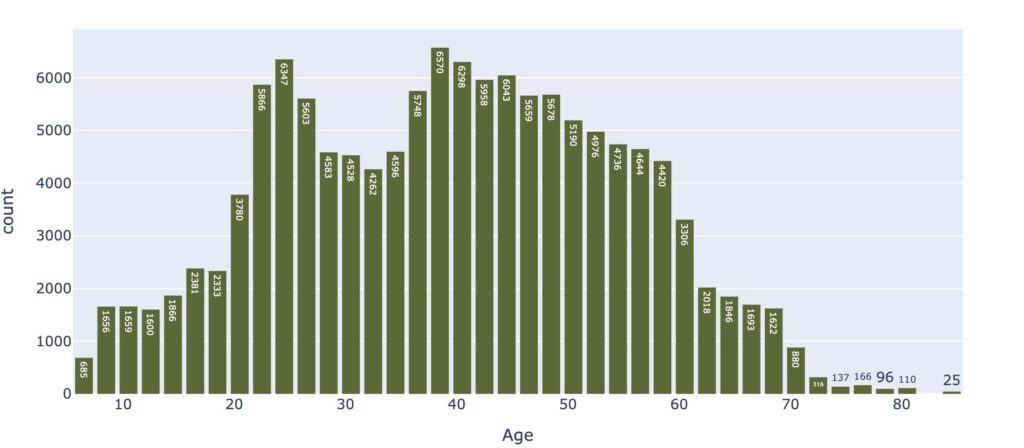
The dataset includes passenger demographics (age, gender), trip attributes (travel type, class), operational data (departure and arrival delays, flight distance), and fourteen one-to-five service‐quality ratings (e.g., Wi‑Fi, seat comfort, cleanliness). With roughly 65% of respondents indicating “satisfied” and the majority aged between 30 and 45, it is important to address class imbalance and potential multicollinearity during analysis.
Completeness And Missingness
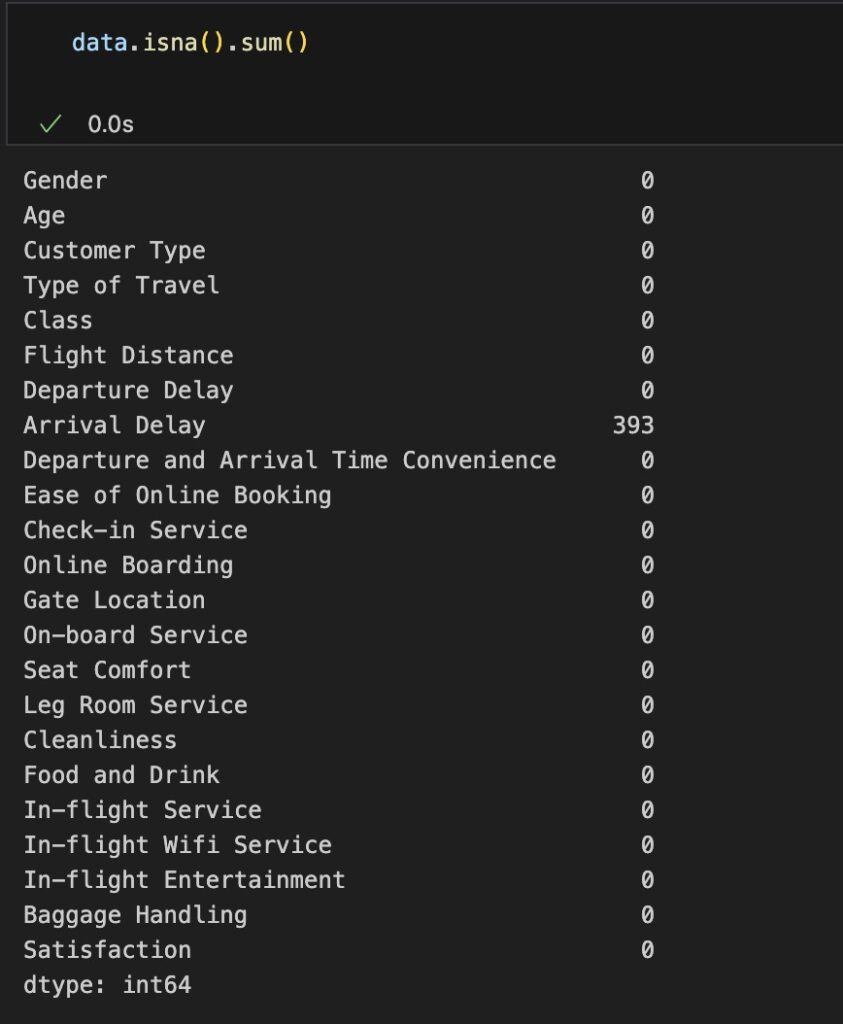
All fields are populated—no null or empty cells—and “0” is used exclusively in the Arrival Delay field to indicate “not applicable.” When a flight has no arrival delay, Arrival Delay is recorded as “0” rather than left blank. Because “0” serves only as a placeholder (not a true value), these zeros must be treated as missing when computing statistics or performing analyses on that variable.
Upon inspecting the dataset, we discovered that the “Arrival Delay” column contained 393 missing entries. To preserve the full sample and reduce potential bias, we imputed these gaps with the column’s mean value (approximately 15.09 minutes). By replacing missing values with the mean, we maintain the dataset’s integrity while minimizing distortion; however, one could also consider median imputation or model‐based methods if the delay distribution proved highly skewed.
data["Arrival Delay"] = data["Arrival Delay"].fillna(data["Arrival Delay"].mean())
Representativeness And Bias
Self‐Selection Bias: Voluntary participation means respondents are often those with very positive or very negative experiences, while moderate opinions may be underrepresented. As a result, average satisfaction scores could be skewed toward the extremes.
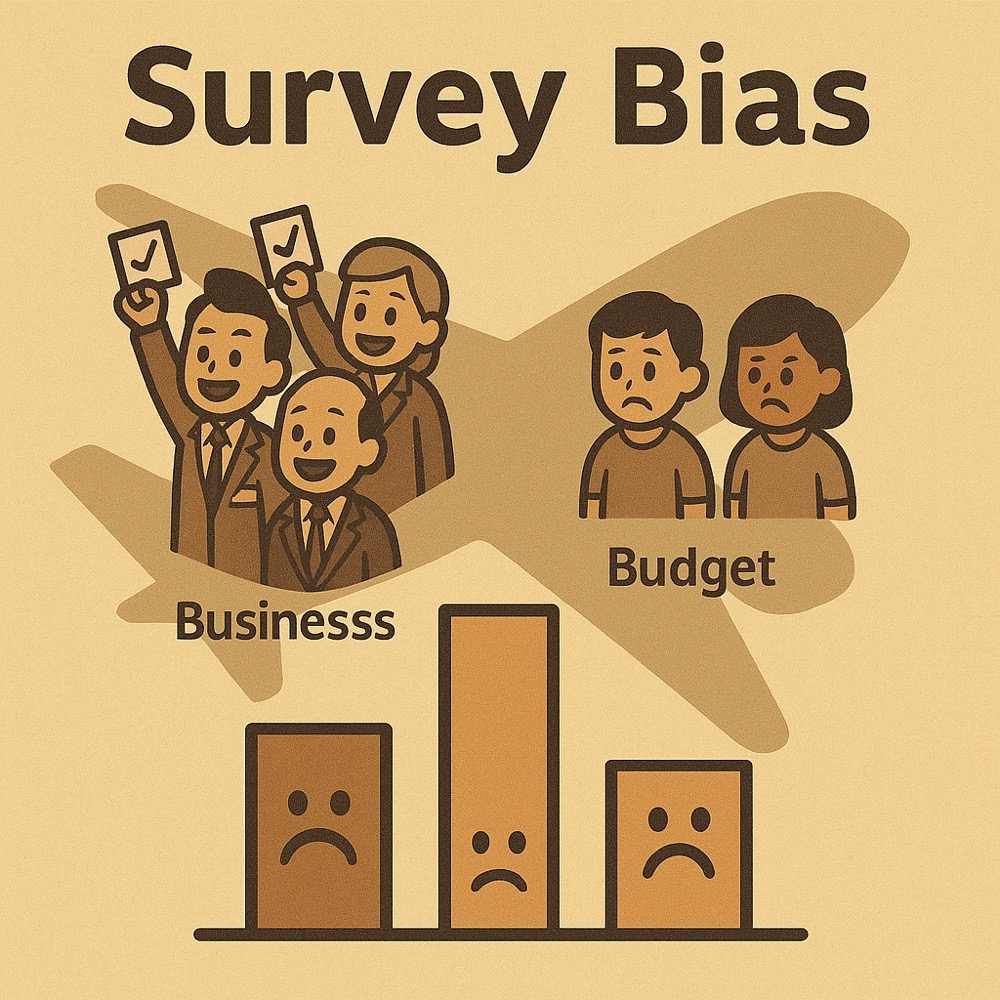
Sampling Frame Constraints: If the survey was offered only to passengers with a valid email on file or only on certain routes (for example, long‐haul international flights), budget travelers and infrequent flyers may be underrepresented. This limits how well the dataset reflects the broader passenger population.
Potential Operational Bias: Feedback might be collected during a specific period (e.g., immediately following a major service change) omits any operational shifts that occurred before or after that window (e.g., staffing strikes or policy updates). Therefore, the dataset may not generalize to other periods.
Limitations
Binary “Satisfaction” Label: The overall Satisfaction field is coded only as “Satisfied” versus “Neutral or Unsatisfied.” By collapsing what could be an ordinal or continuous scale into a binary outcome, important distinctions are lost. For example, a passenger who feels “neutral” and one who feels outright “unsatisfied” are treated identically. In contrast, using a one-to-five scale (analogous to the service subratings) would preserve nuance, enable finer segmentation, and yield more precise insights for modeling.
Cross-Sectional Design: Each passenger in the dataset appears only once, with no repeated observations over time. As a result, it is impossible to track changes in an individual’s satisfaction across multiple flights. Any attempt to assess causal effects, such as “Did satisfaction improve after rolling out a new boarding process?”—cannot be supported without a longitudinal or panel structure.