What Went Into Our Project – Sources, Processing, Presentation, Team Members, and Acknowledgements
Sources
This project analyzes over 129,000 passenger reviews to identify which factors most strongly influence airline satisfaction. Our primary dataset, titled airline_passenger_satisfaction.csv, includes anonymized responses from passengers, each labeled as either “Satisfied” or “Neutral/Dissatisfied.” The data captures a diverse range of inputs: service ratings (seat comfort, inflight Wi-Fi, onboard service, cleanliness, food and drink), operational metrics (arrival delays, flight distance), and contextual variables such as travel class, type of trip, and customer loyalty status.
To complement the dataset, we compiled an annotated bibliography of more than 15 peer-reviewed academic sources and industry reports. These readings explored customer satisfaction modeling, service quality assessment in aviation, behavioral patterns in consumer feedback, and the economic implications of airline performance metrics. Some articles focused specifically on the impact of delays and service perception, while others analyzed broader trends in loyalty retention and digital customer experience. This literature not only deepened our understanding of the factors behind satisfaction but also guided the structure of our hypotheses and informed how we interpreted the model outputs.
By integrating structured passenger data with academic insights, we approached our research from both an empirical and conceptual standpoint. This allowed us to combine quantitative modeling with a broader understanding of how satisfaction is measured, perceived, and acted upon within the airline industry.
Processing
Our analysis began with a structured data preparation pipeline. The first step involved cleaning the dataset by removing unnecessary or redundant features. For example, we dropped “Departure Delay” because it almost perfectly correlated with “Arrival Delay,” which helped reduce noise and improve model performance. Categorical variables such as “Class,” “Customer Type,” and “Type of Travel” were encoded using label encoders so they could be interpreted numerically by machine learning algorithms. Continuous variables were standardized using z-score normalization to ensure equal weight across features during training.
We then split the data into training, validation, and test sets to establish a reliable framework for model evaluation. This allowed us to fine-tune hyperparameters and compare performance across models with minimal risk of overfitting. Our team tested several classification algorithms including Decision Trees, AdaBoost, XGBoost, and Random Forest. After comparing performance metrics, Random Forest was selected as the final model due to its balance of high accuracy and interpretability. The model also provided a ranked list of feature importances, which allowed us to identify the most influential factors contributing to passenger satisfaction. These included Onboard Service, Seat Comfort, Leg Room, Cleanliness, and Inflight Wi-Fi. Each of these variables consistently appeared as top contributors across multiple runs.
During development, we encountered challenges related to class imbalance, as a majority of passengers in the dataset were labeled “Satisfied.” To address this, we used stratified sampling during data splitting to preserve the original class proportions. We also observed overlapping or collinear service categories that risked inflating the influence of related features.
We resolved this by conducting exploratory analysis and removing or consolidating highly correlated inputs. All preprocessing and modeling were completed in Python using pandas, sci-kit learn, and other supporting libraries. The result was a reproducible, efficient pipeline that enabled us to translate raw survey data from airlines into meaningful, interpretable insights about what matters most in the flight passenger experience.
Presentation
We built and designed our project website using WordPress, hosted through UCLA’s HumSpace platform. Our goal was to make the findings as accessible and intuitive as possible, even to users with no background in data science. The site features a focused set of visualizations that guide viewers through the key drivers of airline passenger satisfaction. These include a comparative bar chart showing the proportion of satisfied versus dissatisfied passengers, as well as a distribution plot of passenger age to establish the demographic makeup of the dataset.
We also present a series of box plots that visualize the spread and consistency of customer ratings across categories like onboard service, inflight Wi-Fi, seat comfort, cleanliness, and leg room. Additional visualizations include plots of arrival delays and flight distances, providing insight into how operational logistics vary across the dataset. To summarize our model’s findings, we include a feature importance chart from our Random Forest classifier, ranking the variables that most strongly influence satisfaction.
We prioritized readability by using large fonts, high contrast, and a consistent visual structure across pages. All content follows a clear narrative flow: introducing the problem, explaining the data, presenting our results, and closing with key takeaways. Thanks to WordPress’s flexibility and HumSpace’s integration with UCLA resources, we were able to tailor the site for both clarity and accessibility, ensuring that it remains readable across all devices.
Meet The Team
Benjamin Anderson
Project Manager

Mingyang Xia
Data Visualization
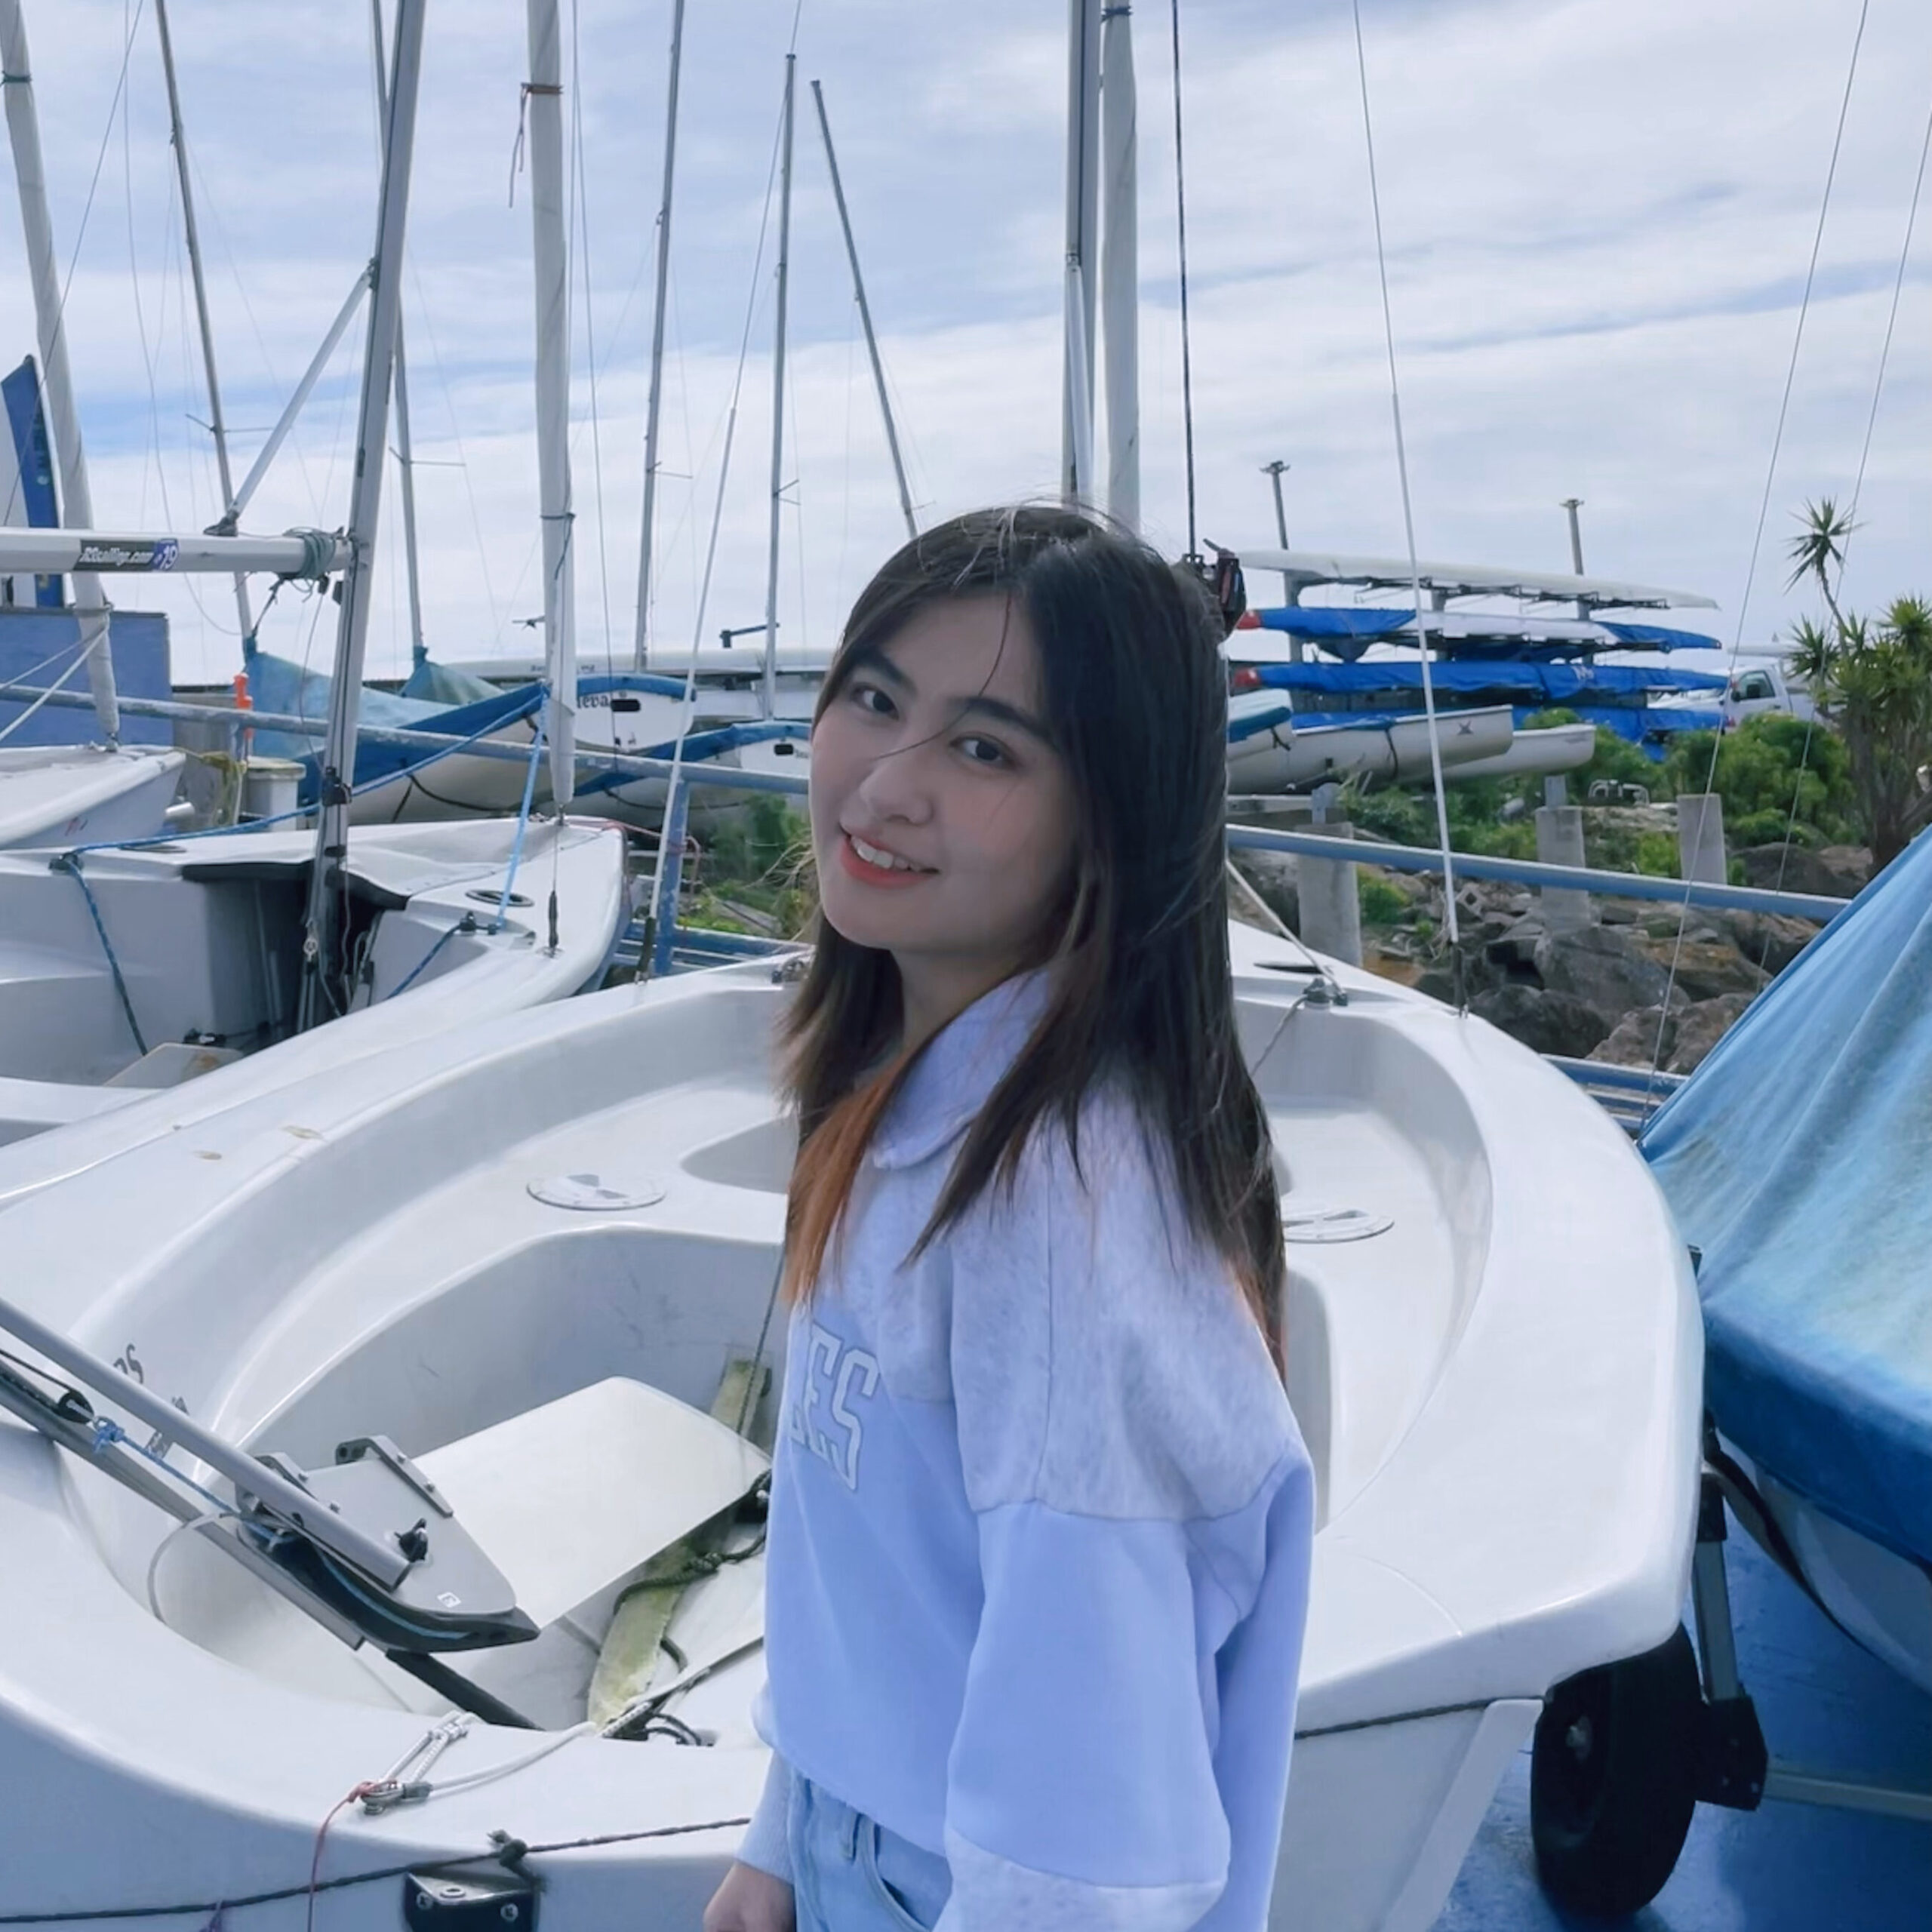
Villa Zhang
Data Visualization

Hi, my name is Benjamin and I am a third-year Geography and Environmental Studies major and GIS&T and Digital Humanities minors.
As the project manager, I coordinated team meetings, set deadlines, and ensured all components of the project stayed on track and aligned with our goals.
Favorite vacation spot: Copenhagen
Hi, my name is Mingyang. I am a senior student majoring in Applied Mathematics.
As the data visualization specialist, I transformed complex datasets into clear and engaging visual formats to support our narrative and analysis.
Favorite vacation spot: Hawaii
Hi, my name is Villa. I’m a third-year student majoring in Statistics and Data Science with an Accounting minor.
As the content developer, I researched, wrote, and edited textual content to effectively communicate our findings and message.
Favorite vacation spot: Spain
Emily Zhang
Web Designer

Brandon Kim
Content Developer
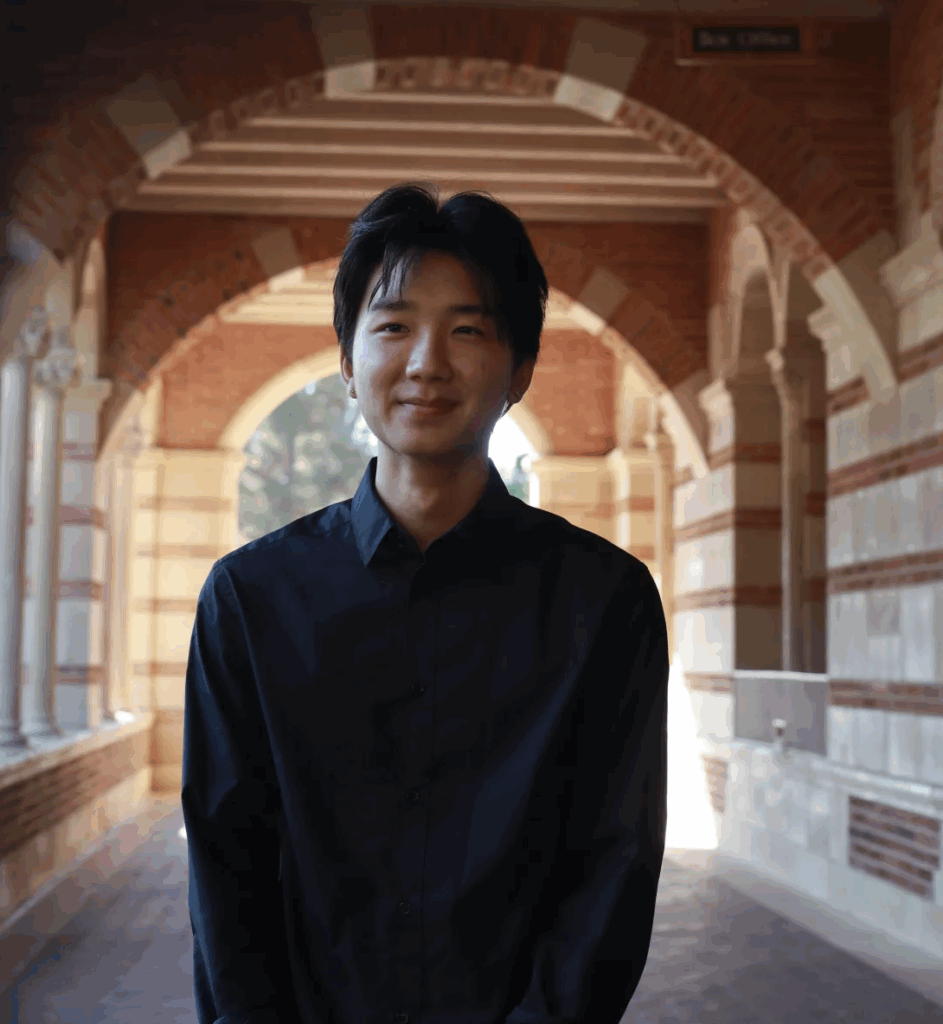
Levina Li
Machine Learning Specialist

Hi, my name is Emily! I am a second-year student majoring in computer science.
As the web designer, I created the layout, user interface, and overall aesthetic of the website to provide a seamless and accessible experience.
Favorite vacation spot: Caribbean Islands
Hi, my name is Brandon! I am a third-year student majoring in Statistics and Data Science.
As the content developer, I helped structure and refine written content, ensuring clarity, accuracy, and consistency across all project materials.
Favorite vacation spot: Germany
Hi, this is Levina! I am a junior from the bay and double majoring in Data Science and Pure Math.
As the machine learning specialist, I designed and implemented algorithms to analyze data patterns and support predictive insights within our project.
Favorite vacation spot: Tokyo
Acknowledgements
We would like to thank Dr. Nicholas Sabo for his thoughtful feedback and guidance throughout the development of our project. His insight during office hours challenged us to rethink parts of our original approach, and several of his comments directly influenced key changes in how we framed our research questions, structured our analysis, and presented our findings.
We also thank Cameron Manning for his support during discussion sections and office hours. His consistent responsiveness and clear explanations helped us troubleshoot technical issues quickly and refine our methods as the project evolved.
We’re grateful to each member of our group for their consistent communication, reliability, and dedication throughout the project. Every member contributed to the editing process and invested significant time and effort to bring this work to completion. The final product reflects our collective flexibility, collaboration, and commitment as we adapted to changes and moved the project forward together.