Introduction
In the modern U.S. airline industry, where pricing and flight routes are largely uniform across carriers, customer experience has emerged as a key differentiator.
This project investigates the drivers of passenger satisfaction using a 2020 Kaggle dataset that captures over 129,000 individual survey responses. The dataset includes detailed information on traveler demographics, flight characteristics, and ratings across 23 service categories, from booking and boarding to in-flight comfort and Wi-Fi access, along with an overall satisfaction indicator.
Our group argues that intangible service factors, such as seat comfort, cabin cleanliness, and crew service quality, have a stronger impact on passenger satisfaction than operational metrics like delays or pricing. By analyzing patterns within this rich dataset, the project aims to identify the specific service elements that most influence satisfaction, offering data-driven insights for how airlines can better invest in the passenger experience.
These findings have real-world significance. In a market where flight times, pricing, and routes are increasingly standardized, airlines have limited ways to stand out. Enhancing service quality becomes one of the most effective ways to earn customer loyalty. By identifying which specific parts of the passenger experience matter most, airlines can make informed decisions about where to invest their time, training, and resources. For travelers, this means their survey feedback can directly influence how airlines improve comfort, efficiency, and overall service in ways that actually respond to their needs.
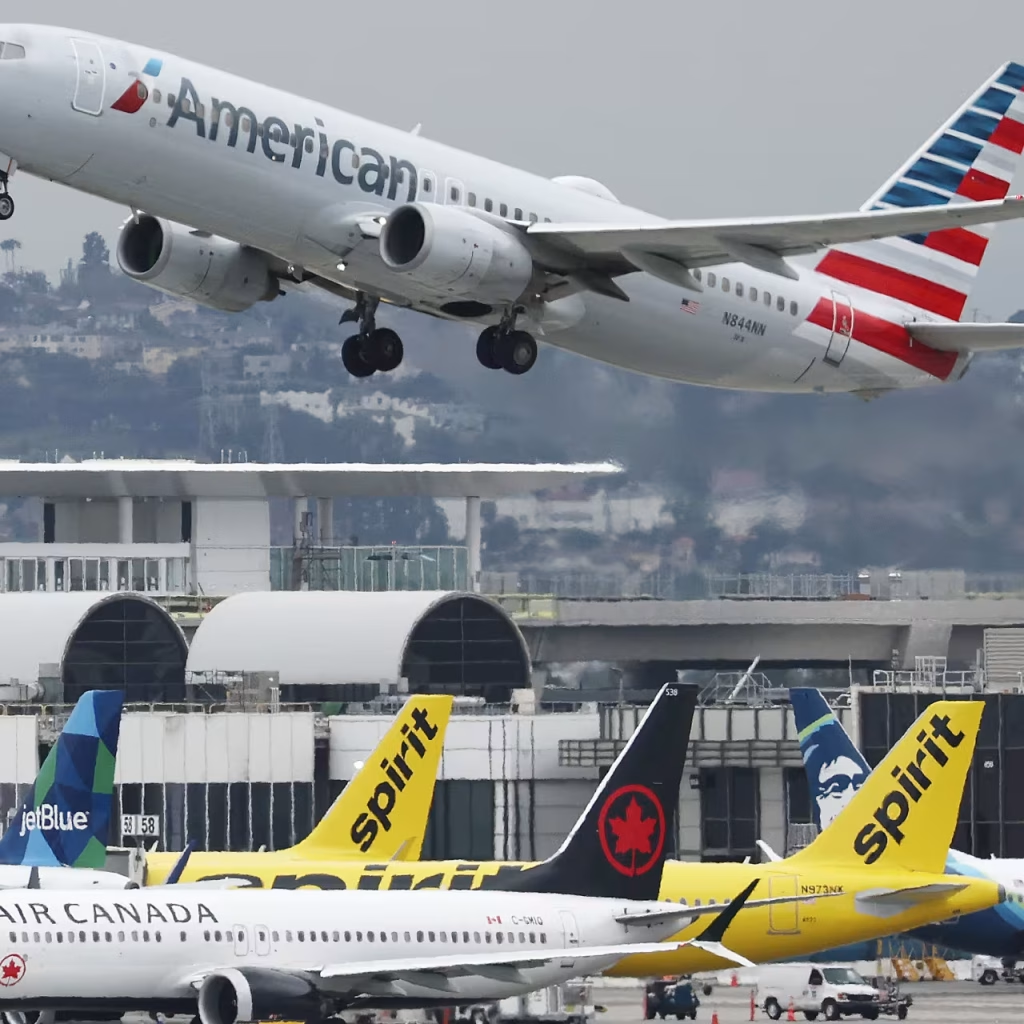
Image source: Barron’s
Literature Review
The current industry insight on airline satisfaction and safety highlights a broad consensus that service quality, delay management, and safety perception are key determinants of passenger experience. Studies by Ban and Kim (2019) and Rahme (2023) emphasize that customer reviews and sentiment data provide actionable insight into satisfaction, especially regarding in-flight Wi-Fi, seating comfort, and cleanliness. Similarly, Wang (2023) and Ringle et al. (2011) find that factors like class of service, type of travel, and perceived safety significantly influence overall ratings, with leisure travelers especially sensitive to safety signals. Scholars generally agree that operational disruptions negatively impact satisfaction and trust (Liu & Zeng, 2007; Li et al., 2015), and that safety incidents have long-term effects on airline reputation and demand (Blunk et al., 2006).
However, some tension exists in how scholars weigh objective safety data versus subjective customer perception; for instance, while Boeing’s statistical report (2025) shows a 65% reduction in fatal accident rates over two decades, public fear and perceived risk often remain disproportionately high. A gap still exists in bridging these perspectives, few studies quantitatively link detailed service features with satisfaction at scale using modern machine learning tools. This project addresses that gap by applying predictive models to a large survey dataset, offering a more granular, data-driven approach to understanding what drives airline satisfaction in practice.
The importance of this research goes beyond academic interest. For airlines, knowing which service features matter most can help them prioritize meaningful upgrades instead of broad, unfocused improvements. Investments in areas like cabin cleanliness or reliable in-flight Wi-Fi may yield stronger results than changes that are less tied to passenger satisfaction. For policymakers and regulators, this type of evidence can support more targeted consumer protection policies and clearer service standards. And for passengers, this research helps translate everyday frustrations into concrete insights, creating pressure for more human-centered and responsive airline experiences.
Significance
This project examines which aspects of the flight experience have the strongest influence on passenger satisfaction, offering airlines clearer guidance on how to enhance customer experience beyond common strategies like reducing delays or lowering prices. While industry conversations often emphasize operational efficiency or cost competitiveness, few studies utilize large-scale, individual-level survey data to rigorously assess the relative impact of service quality factors.
By analyzing over 129,000 real-world passenger responses, this research highlights how “soft” elements, such as seat comfort, in-flight service, and cabin cleanliness, play a critical role in shaping overall satisfaction.
In doing so, the project contributes to broader discussions on how firms in commoditized, low-margin industries can create differentiated value through improved service design and customer experience strategies. For airlines, this suggests that investing in more human-centered improvements such as better crew training, upgraded in-flight amenities, or thoughtful cabin layout can lead to stronger customer loyalty, improved brand perception, and increased long-term revenue. For travelers, these findings reinforce the idea that their feedback is meaningful and that airlines can make better decisions by paying attention to the service factors passengers care about most.
Mapping Passenger Traffic Across the Country
The current industry insight on airline satisfaction and safety highlights a broad consensus that service quality, delay management, and safety perception are key determinants of passenger experience. Studies by Ban and Kim (2019) and Rahme (2023) emphasize that customer reviews and sentiment data provide actionable insight into satisfaction, especially regarding in-flight Wi-Fi, seating comfort, and cleanliness. Similarly, Wang (2023) and Ringle et al. (2011) find that factors like class of service, type of travel, and perceived safety significantly influence overall ratings, with leisure travelers especially sensitive to safety signals. Scholars generally agree that operational disruptions negatively impact satisfaction and trust (Liu & Zeng, 2007; Li et al., 2015), and that safety incidents have long-term effects on airline reputation and demand (Blunk et al., 2006).
Data Visualization
#1) High Correlation Between Departure and Arrival Delays, Strong Link Between Online Booking and Boarding, and Removal of Low-Impact Features Like Age and Flight Distance
The Correlation Heatmap provides a comprehensive overview of how various operational metrics and service quality variables relate to one another. The most striking correlation appears between Departure Delay and Arrival Delay, with a coefficient of 0.96. This indicates that these two variables are almost interchangeable, which aligns with the operational reality that delayed departures typically lead to late arrivals. It also reinforces past findings by Liu & Zeng (2007) and Li et al. (2015) that operational disruptions are tightly linked and have cascading effects on customer satisfaction.
Another critical cluster emerges in Ease of Online Booking and Online Boarding, exhibiting a strong positive correlation of 0.71, suggesting that passengers who find the ticket purchase process seamless also tend to rate the boarding experience positively. This mirrors Ban and Kim’s (2019) emphasis on the importance of seamless digital interactions and confirms that user experience in pre-boarding stages plays a crucial role in shaping overall satisfaction. This implies that improvements in the digital airline’s app or website could simultaneously enhance multiple customer experiences.
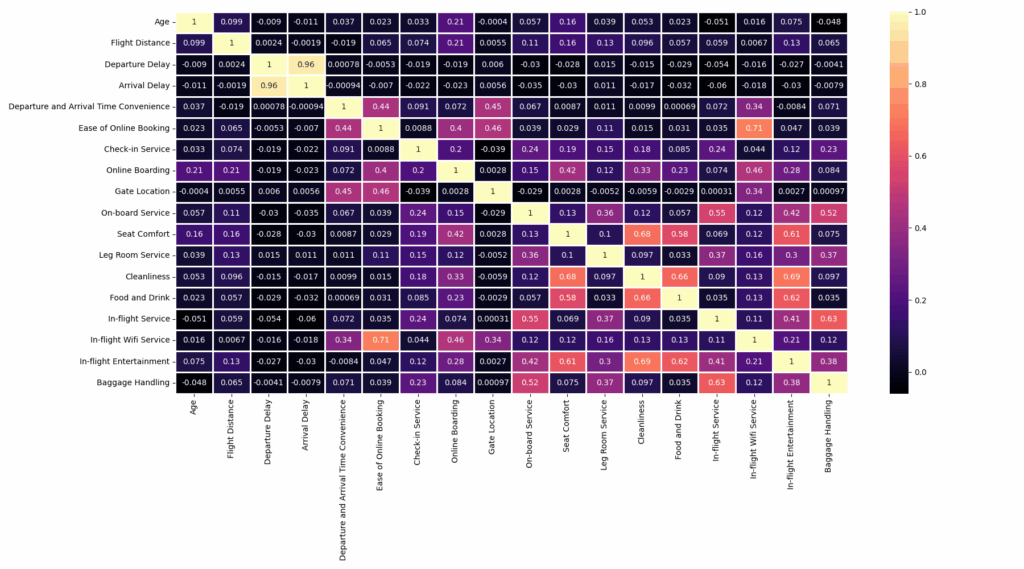
In contrast, features like Age and Flight Distance show very weak correlations with the rest of the dataset, meaning they operate independently and are unlikely to distort model behavior through multicollinearity.
Overall, the heatmap helped us identify which variables could be removed, combined, or retained. It served as an essential tool in shaping our preprocessing decisions and allowed us to focus the model on features that carry distinct, non-redundant information.
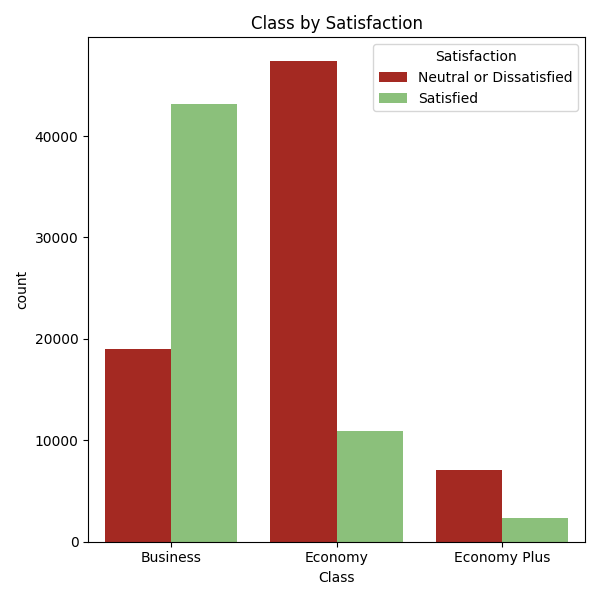
#2a) Higher Comfort Comes with a Better Satisfaction
The Class by Satisfaction chart shows a strong positive correlation between cabin class and passenger satisfaction. Business class passengers reported the highest satisfaction rates, with more than twice as many passengers satisfied compared to those who were neutral or dissatisfied. In contrast, the majority of Economy and Economy Plus passengers expressed dissatisfaction, while only about one in five travelers reported a positive experience. These findings support Ringle et al. (2011), who emphasize the importance of class of service and travel purpose in shaping customer satisfaction, particularly for leisure travelers, who are especially sensitive to perceived comfort and safety.
This stark contrast suggests that cabin class is not only a proxy for comfort but also for service quality and perceived value. It reinforces the idea that passengers who pay a premium expect, and likely receive, more responsive in-flight attention, fewer disruptions, and better overall treatment. Those who can afford business class are not just paying for comfort; they are buying access to a social environment where their needs are prioritized. This reinforces a broader economic disparity, where higher satisfaction is effectively purchased, while those with fewer financial resources are more likely to encounter crowding, delays, or inattentive service.
The near-identical dissatisfaction rates between Economy and Economy Plus also suggest that mid-tier options may fail to meet expectations. Passengers who pay more for an “upgraded” experience may still feel underserved if the improvements are marginal or not clearly communicated. This gap between expectation and reality may increase frustration and contribute to lower satisfaction, especially for those seeking affordable upgrades as a middle ground between price and comfort.
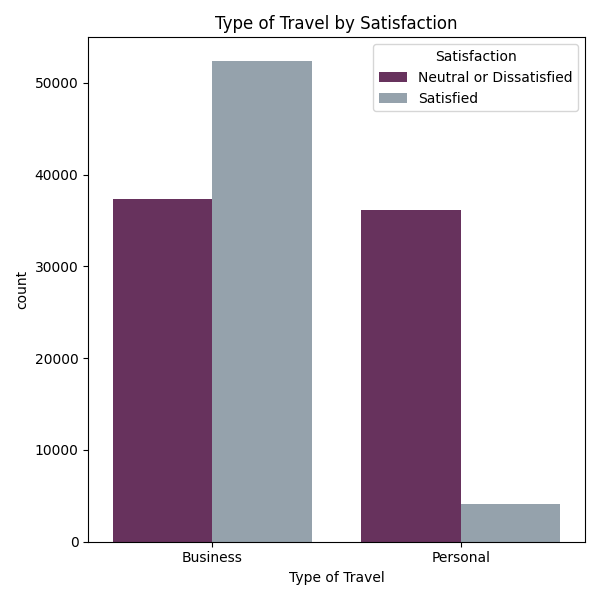
#2b) Travel Purpose Drives Satisfaction: Business Over Leisure
The Type of Travel by Satisfaction chart suggests that travel purpose significantly shapes how customers evaluate their flying experience. Business travelers are more likely to report satisfaction compared to leisure travelers, even though they likely face similar flight conditions. One possible explanation is that business travelers often enjoy additional perks sponsored by their employer, such as premium seating, priority services, and streamlined check-in processes.
Personal travel, on the other hand, is often funded by the traveler themselves and carries emotional expectations, such as relaxation, family reunions, or vacations. When delays, discomfort, or poor service occur, the disruption can feel more personal and disappointing. Leisure travelers are also less likely to receive premium treatment or loyalty benefits, which may contribute to their lower satisfaction. Bezerra et al. (2021) further highlight that non-frequent travelers hold different service expectations, making them more sensitive to unmet promises or discomfort. Leisure passengers also tend to receive fewer loyalty perks and less personalized service, reinforcing the satisfaction gap.
This disparity raises important considerations for equity and customer service in the airline industry. If airlines are more focused on serving business travelers because of their higher spending, personal travelers may be left with a lower quality of service. The data highlights the need for airlines to reassess how they serve non-business passengers, particularly during peak travel seasons when stress levels are higher and service inconsistencies are more likely. Addressing this imbalance could help ensure a more equitable experience for all types of travelers.
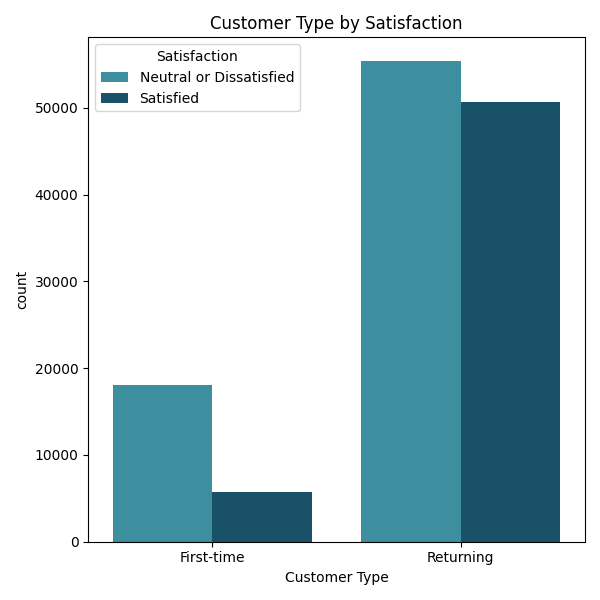
#2c) Frequent Flyers Enjoy Higher Satisfaction; New Travelers Left Behind
The Customer Type by Satisfaction chart emphasizes the critical role of customer loyalty. Returning customers showed much higher satisfaction than first-time flyers. Returning customers are far more likely to report a positive experience, while first-time flyers overwhelmingly report dissatisfaction. This suggests that repeat customers benefit not only from familiarity but also from loyalty programs that reward them with upgrades, faster service, and preferential treatment.
This finding echoes Leon & Martín (2020), who demonstrate that satisfaction often stems from a mix of technical factors (like efficiency and punctuality) and functional ones (like recognition and personalized service), both of which are more available to frequent flyers. Airlines are incentivized to retain loyal customers by offering perks such as lounge access, faster boarding, and personalized offers. However, Sezen et al. (2018) emphasize that these loyalty-driven benefits can skew service quality toward certain demographics or travel patterns, leaving newer or infrequent travelers with less support and lower perceived value.
This issue reflects how trust and loyalty are built into the airline system. Airlines are more likely to invest in keeping frequent flyers happy, offering perks like lounge access, early boarding, and seat upgrades. First-time travelers, on the other hand, may be unfamiliar with how to navigate airport logistics or how to access better service. They are also less likely to receive priority treatment, which could make them feel overlooked or under-supported.
From a broader perspective, this points to a service system that favors existing relationships and potentially disadvantages new or infrequent travelers. It suggests that customer experience is not just shaped by the flight itself, but by a traveler’s accumulated history with the airline. While loyalty programs are valuable marketing tools, airlines must be mindful not to let them reinforce inequality in the passenger experience. Improving support for first-time passengers could not only boost their satisfaction but also help build long-term loyalty and trust.

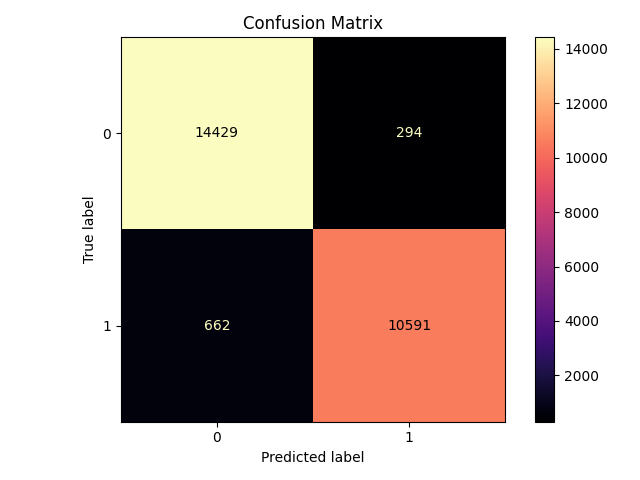
#3) High Accuracy, High Impact: Using XGBoost to Predict Customer Satisfaction
We compared four classifiers—Decision Tree, Random Forest, AdaBoost, and XGBoost—on our dataset. XGBoost emerged as the top performer, achieving an overall accuracy of 96.28%. Its confusion matrix breakdown shows that out of all negative instances, it correctly labeled 14,429 as negative (true negatives), and out of all positive instances, it correctly labeled 10,591 as positive (true positives), demonstrating both high specificity and sensitivity.
This finding underscores the growing role of advanced ensemble models in customer experience research. As Syed et al. (2024) demonstrate using deep learning methods like BERT and PEGASUS, customer satisfaction can be reliably predicted using review data. Similarly, Srinivas & Ramachandiran (2020) show that machine learning applied to online airline reviews can uncover systemic service issues and identify priority areas for improvement.
This result supports the value of using advanced ensemble methods for prediction in customer experience research. The model’s strong performance not only confirms that passenger satisfaction is predictable from service and operational variables, but also suggests that machine learning can help airlines identify improvement areas before dissatisfaction becomes widespread. With further tuning or real-time deployment, models like this could help prioritize service recovery efforts or proactively target at-risk customer segments.
#4) Digital First: Wi-Fi and Online Boarding Surpass Traditional Amenities in Driving Satisfaction
The feature chart highlights which variables most strongly influence the model’s prediction of passenger satisfaction. In-flight Wi-Fi Service stands out as the most impactful factor by a large margin, contributing nearly half of the total predictive power. This suggests that digital connectivity has become a core expectation for modern travelers, outweighing even traditional service elements like seat comfort or food. Following Wi-Fi, Online Boarding, Type of Travel, and Class also show meaningful influence, reinforcing that both digital experience and travel context shape how passengers perceive their flight. This trend is strongly supported by Park et al. (2020), who found that while traditional service aspects like punctuality and staff courtesy still matter, satisfaction is increasingly driven by how smoothly the full journey, especially digital touchpoints, is managed.
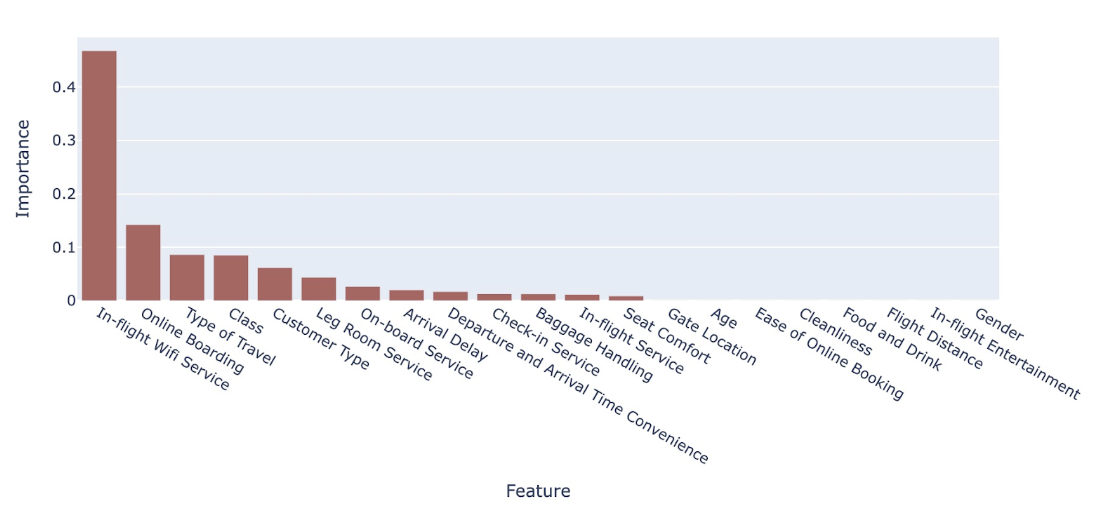
In contrast, variables such as Check-in Service, Leg Room, Cleanliness, and Entertainment have minimal importance in the model. These insights suggest that airlines aiming to improve satisfaction should prioritize investments in Wi-Fi reliability and user-friendly digital interfaces, especially for economy and leisure travelers who report lower satisfaction overall.
These results suggest that airlines should rethink their investment strategies, particularly for economy and leisure travelers, who tend to report lower satisfaction and are less likely to receive high-touch service. As Ban & Kim (2019) note, passengers increasingly mention digital convenience in online reviews, meaning that improving Wi-Fi reliability, app interfaces, and self-service tools may deliver stronger satisfaction gains than marginal upgrades to physical amenities.
Finally, the feature heat map also helps identify redundancies and multicollinearity. It offers critical insight into where airlines can focus to enhance both perception and performance.
Little Stories: George’s Smooth Ride and Paul’s Flight Fiasco
Applying our findings toward hypothetical passenger experiences
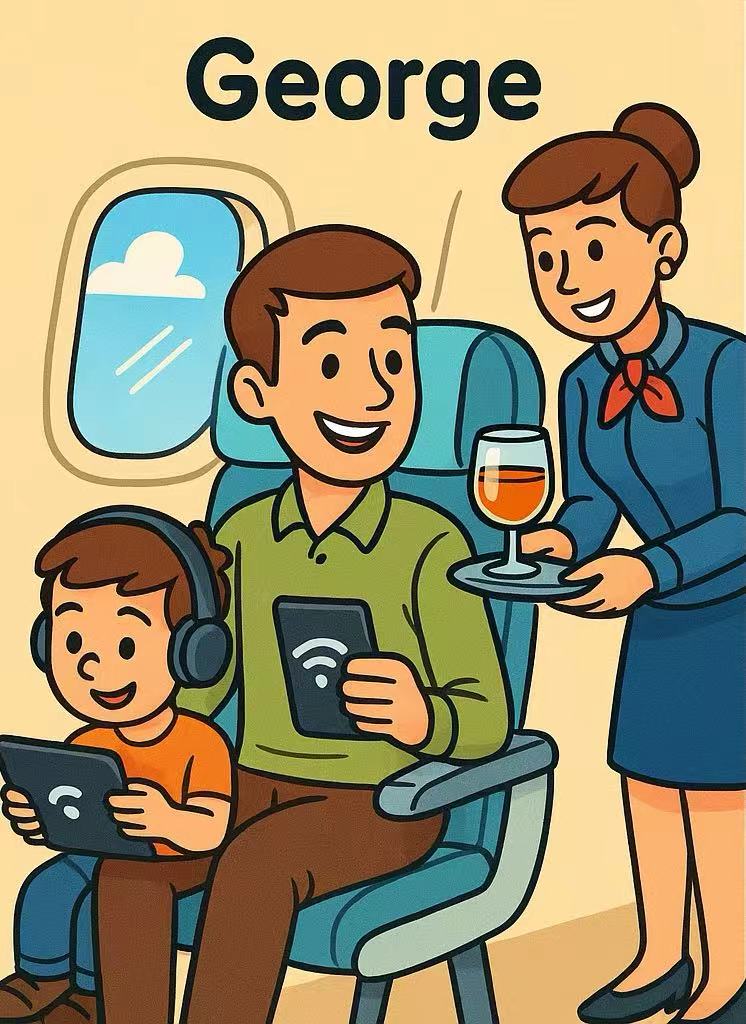
George booked his Premium Economy seat online in seconds. At the airport, a friendly agent saw his name and loyalty status, then sent him through priority boarding. He settled into his extra-legroom seat with a welcome drink, feeling instantly comfortable.
Once in the air, George connected to the in-flight Wi-Fi he had paid for. The signal stayed strong, so he finished urgent work emails and joined a quick video call without glitches. His nephew, traveling with him, got a tablet loaded with games and movies, keeping him happy while George stayed productive.
A few hours later, the flight attendant served a complimentary hot chicken lunch with a fresh salad. When George mentioned he was still hungry, the attendant brought an extra fruit plate. Near landing, George got a phone alert about a gate change. He followed the update and calmly caught his connections without rushing.
After landing, George filled out a short survey. He gave top marks for Wi-Fi, booking, seat comfort, service, and real-time alerts. Because every detail felt personal and easy, he clicked “Very Satisfied”—and immediately booked his next trip with the same airline.
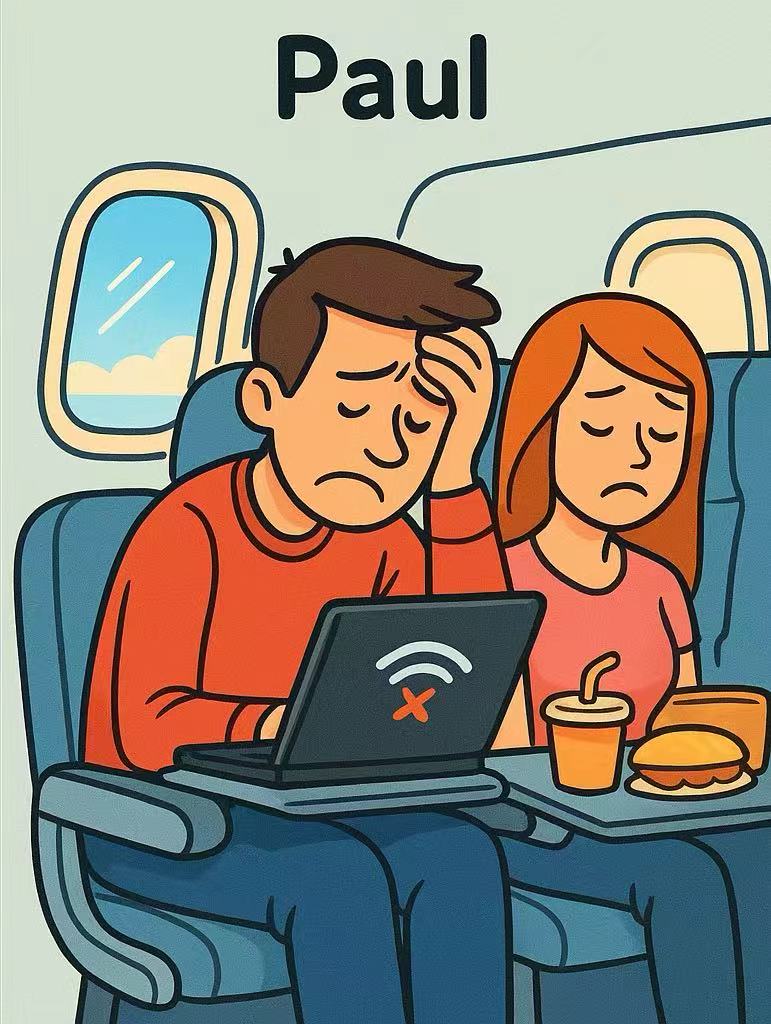
By contrast, Paul booked a regular Economy seat last minute. He waited in a long line at the counter because his loyalty status didn’t qualify him for priority. His seat felt cramped, and there was no welcome drink to start the trip.
Once the flight took off, Paul paid for Wi-Fi but struggled with slow, spotty service. His emails timed out, and his video call dropped. Amber, traveling with him, had no preloaded entertainment and grew bored, and Paul felt stressed trying to calm her.
For lunch, Paul purchased a cold sandwich and a small juice. When he asked for extra fruit, the attendant said it wasn’t available. As the plane neared its destination, Paul didn’t get a in-flight gate-change alert. He only found out after landing and ran through the terminal, almost missing his connection.
When Paul completed the survey, he rated Wi-Fi, onboard service, and seating all low. He felt frustrated and “Neutral or Dissatisfied.” He decided to try a different airline next time—hoping for a smoother, less stressful journey
Conclusion
Our analysis shows that the five most important drivers of passenger satisfaction in airline travel (ref: visualization 4):
- Reliability in‐flight Wi‑Fi: In-flight wifi ranks highest because uninterrupted internet access is essential to passengers.
- A seamless online boarding process: smooth boarding experiences to reduce passengers’ stress and wait time.
- The passenger’s type of travel: Business travelers, for whom efficiency and connectivity are significant, report higher satisfaction when these needs are met, but whereas personal travelers place more weight on comfort and amenities.
- The cabin class they choose: Due to the extra space and upgraded services, travelers in business class tend to rate their journeys more favorably.
- Whether they are a frequent or occasional flyer: loyal passengers derive extra value from perks like priority boarding and lounge access report greater satisfaction.
Q1: How does in‐flight Wi-Fi reliability influence ancillary spending and overall satisfaction scores?
Flights with dependable Wi-Fi consistently generate higher ancillary sales and better satisfaction scores in our dataset, because reliable connectivity lets passengers feel socially included rather than isolated. When the network holds steady, business travelers confidently send last-minute emails or join video calls, and younger or family groups stream entertainment without interruption, which are actions that reduce anxiety and encourage add-on purchases like premium Wi-Fi packages or extra legroom. Conversely, passengers who encounter dropped connections often vent frustration in surveys and pull back on other in-flight spending. In this way, strong Wi-Fi reliability becomes a sociological signal, demonstrating that the airline respects passengers’ need to stay connected to work, family, or social circles at altitude, and this trust translates directly into both more ancillary revenue and higher overall satisfaction.
Q2: What is the relative impact of cabin class choice versus frequent-flyer status on repeat booking likelihood?
In our dataset, upgrading to a higher cabin class and holding frequent‐flyer status highly encourage a passenger’s impulse to book again, but they do so in different ways. Choosing business or premium cabins delivers an immediate hit of comfort and prestige. Passengers enjoy extra legroom, quieter cabins, and a sense of “you’re important,” which shows up as higher repeat‐booking rates among those who’ve splurged once. However, frequent‐flyer status operates more like a social contract: when travelers see their loyalty points climb and routinely receive priority boarding or lounge access, they feel like they’re part of an exclusive club. That ongoing recognition often outpaces a one‐off cabin upgrade, because it trickles into every trip rather than just one flight. In short, trying out business class once gives a strong boost to short-term re‐booking enthusiasm, but wearing a loyalty badge builds a steadier, longer‐term bond that nudges passengers to book expensive tickets more persistently.
Maximizing Revenue and Satisfaction Through Targeted Upgrades and Demographic Tailoring
When airlines invest in targeted, cost‑effective upgrades, like offering reliable Wi‑Fi, streamlining the boarding process, adding extra legroom, and training crew for personalized service, they can significantly boost both revenue and passenger loyalty. Real‑world evidence supports our data: In 2024, United Airlines introduced a range of service upgrades that significantly boosted both customer satisfaction and financial performance. The airline partnered with SpaceX to equip over 1,000 aircraft with Starlink high-speed Wi-Fi, offering free, fast, and seamless gate-to-gate internet access for MileagePlus members starting in spring 2025. At the same time, United upgraded more than 300 planes with new interiors, including seatback screens, Bluetooth connectivity, and larger overhead bins, which led to a 4.5-point increase in satisfaction with in-flight entertainment. In addition, after operational improvements, United ranked first in on-time performance across all seven of its U.S. hubs and flew a record 174 million passengers. Altogether, these enhancements contributed to a record $4.2 billion in pre-tax earnings, showing how thoughtful investments in the passenger experience can drive both passengers’ loyalty and company’s revenues (United Airlines, 2025).
For further improvement of passengers’ experiences based on demography, airlines can offer tailored services based on passenger profiles. For example, seniors (65 and up) on long‑haul flights could receive priority boarding, extra legroom seats, and softer cabin lighting for better rest, while younger business travelers on short hops might get free fast‑track Wi‑Fi and contactless boarding. Families on medium‑distance routes benefit from kids’ entertainment available and ample overhead bin space, and solo leisure travelers under 35 on red‑eye flights might be offered complimentary headphones and curated late‑night snack boxes. Airlines can dynamically adjust amenities, like larger print menus for older flyers, in‑seat power outlets for frequent business commuters, or multilingual announcements on international legs. They can address age, trip length, and purpose in a data‑driven way that improves satisfaction across various customer demographics.